Programming in R
John Hinic 2022-07-02
R Programming Reflections
Well, the summer session only has about 1 month left at this point, which feels kind of insane. Regardless, at this point we are done formally learning about “how to program” in R. I think that, for the most part, most of the material would be considered review for me - some areas I absolutely needed the review, while others served more as helpful practice. There were also some topics that we went a good bit deeper than what I knew coming into the class.
One example would be pretty much the whole concept of “functional programming.” I’ve learned about writing functions and their benefits before, and even use little helper functions a fair amount (my job also uses SAS, and I use macros quite a bit for that). But I feel like I’ve started to scratch the surface of real functional programming, which is really exciting and cool on the one hand, but also pretty overwhelming on the other.
When considering the things I am most and least prepared for in industry, I think the process of actually putting a model into production is one of the big ones I will need to learn more about. From what I understand, one part of this (from a data scientist’s perspective) is essentially just wrapping everything up in functions and putting them in scripts, so it’s been really cool learning more about functions in general.
Example
The general rule of thumb is that if you ever write the same code more
than twice, you should put it into a function instead. One time I find
myself needing to copy paste similar code a lot is when I’m performing
some EDA and want to make a bunch of plots with different groupings or
different aesthetics. So, to demonstrate the usefulness of writing
functions to perform these repetitive tasks, I’m going to write a
function that allows me to create a range of plots using ggplot2 and
the mpg dataset.
Before starting, we’ll load in the tidyverse library and show the data
we’ll be using.
library(tidyverse)
head(mpg)
## # A tibble: 6 x 11
##   manufacturer model displ  year   cyl trans      drv     cty   hwy fl    class
##   <chr>        <chr> <dbl> <int> <int> <chr>      <chr> <int> <int> <chr> <chr>
## 1 audi         a4      1.8  1999     4 auto(l5)   f        18    29 p     comp~
## 2 audi         a4      1.8  1999     4 manual(m5) f        21    29 p     comp~
## 3 audi         a4      2    2008     4 manual(m6) f        20    31 p     comp~
## 4 audi         a4      2    2008     4 auto(av)   f        21    30 p     comp~
## 5 audi         a4      2.8  1999     6 auto(l5)   f        16    26 p     comp~
## 6 audi         a4      2.8  1999     6 manual(m5) f        18    26 p     comp~
For the sake of this demonstration, let’s assume the only numeric
variable we are interested in is hwy, and we want to make both box
plots and histograms of that variable. We’ll write a function that takes
in the type of plot we want (“box” or “hist”), if/how we want to group
it (only one level of grouping), and how we want to display the groups
(“color”, “facet”, or “both”).
plotting <- function(type, grp = NULL, grpDisp = "facet") {
  plotfun <- switch(
    type,
    "box" = geom_boxplot,
    "hist" = geom_histogram,
    stop("Invalid plot type supplied")
  )
  if(!is.null(grp)){
    if(grpDisp %in% c("color", "both")) aesOpt <- paste0(", fill = ", grp)
    else aesOpt <- ""

    if(grpDisp %in% c("facet", "both")) facet <- paste0('+ facet_wrap(~', grp, ')')
    else facet <- ""
  } else {
      aesOpt <- ""
      facet <- ""
  }

  funcStr <- paste0('mpg %>% ', paste0('ggplot(aes(', paste0('hwy', aesOpt), ')) + plotfun()', facet))
  funcCall <- str2expression(funcStr)
  eval(funcCall)
}
Now, we can call this single function with only a few arguments to create plots instead of writing several lines for each one. For example:
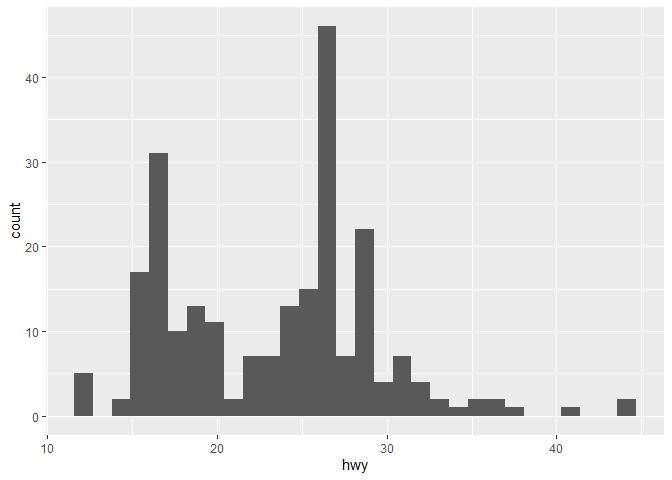
plotting("hist")
## `stat_bin()` using `bins = 30`. Pick better value with `binwidth`.
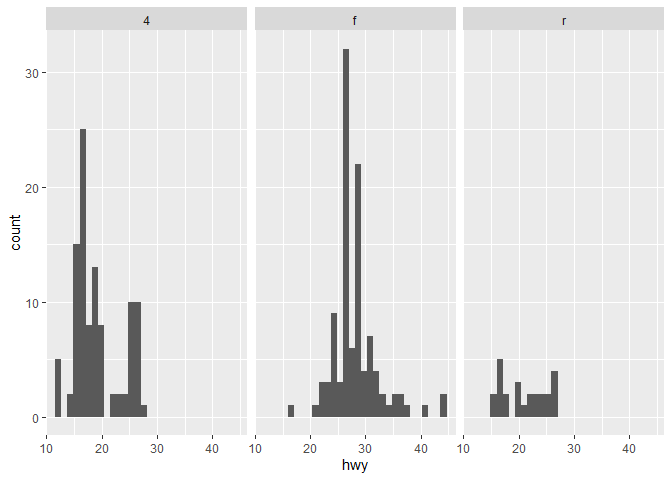
plotting("hist", grp = "drv")
## `stat_bin()` using `bins = 30`. Pick better value with `binwidth`.
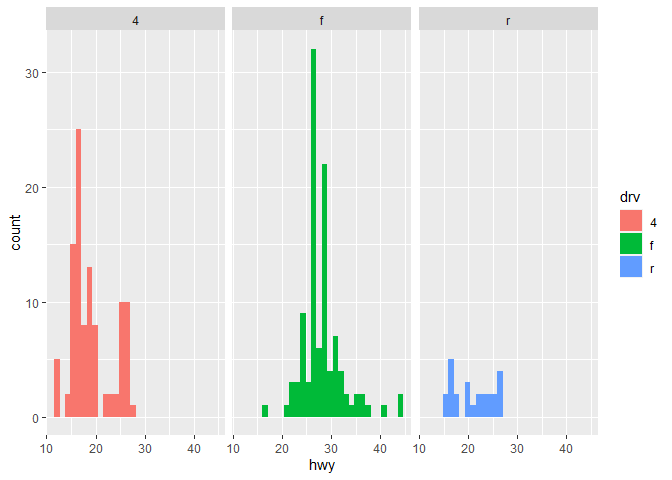
plotting("hist", grp = "drv", grpDisp = "both")
## `stat_bin()` using `bins = 30`. Pick better value with `binwidth`.
plotting("box", grp = "manufacturer", grpDisp = "color")

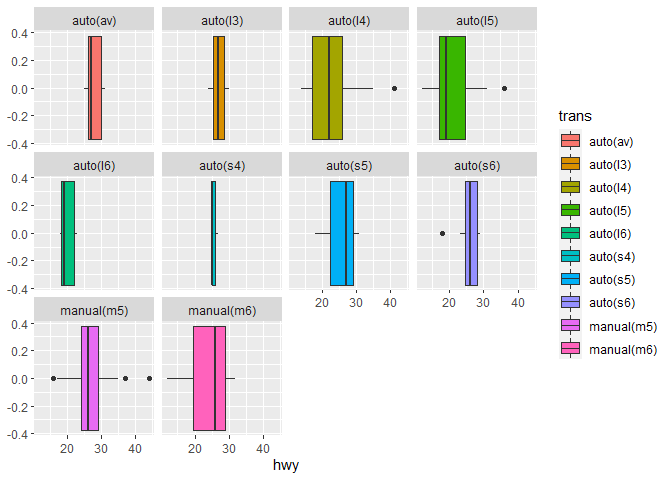
plotting("box", grp = "trans", grpDisp = "both")
This can speed up our workflow quite a bit as long as we have a solid understanding of how to write the functions in a reasonable time-frame.